|
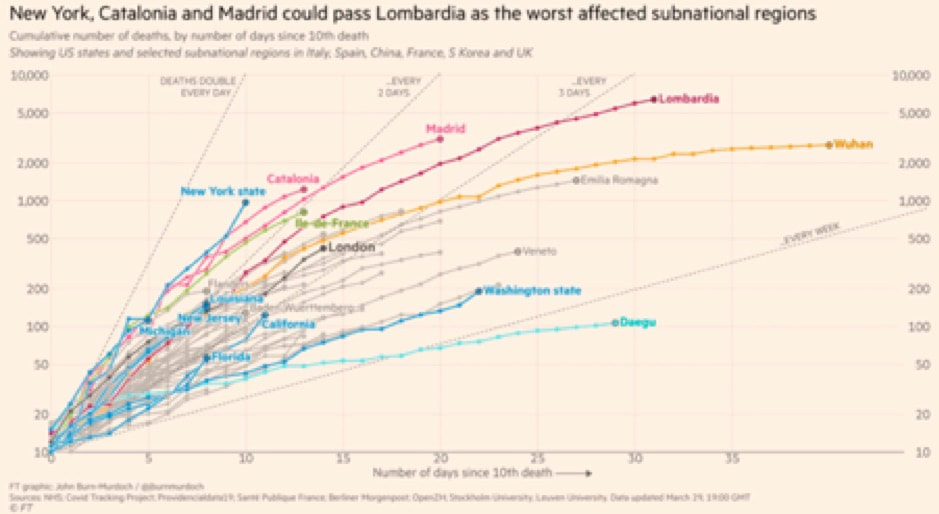
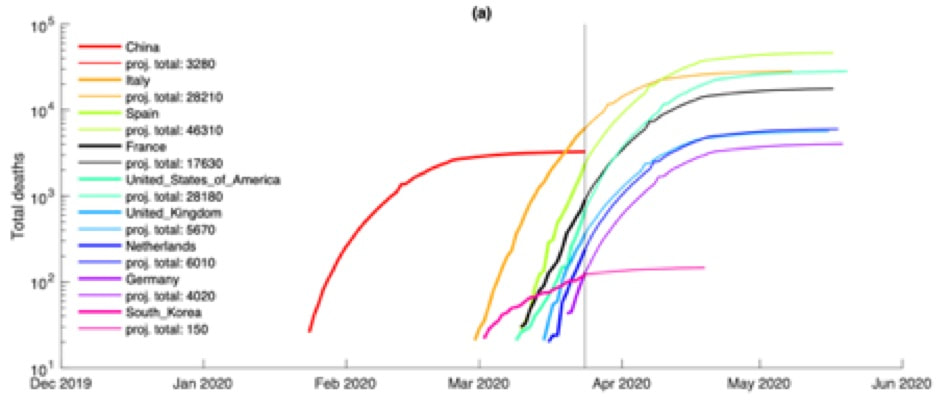
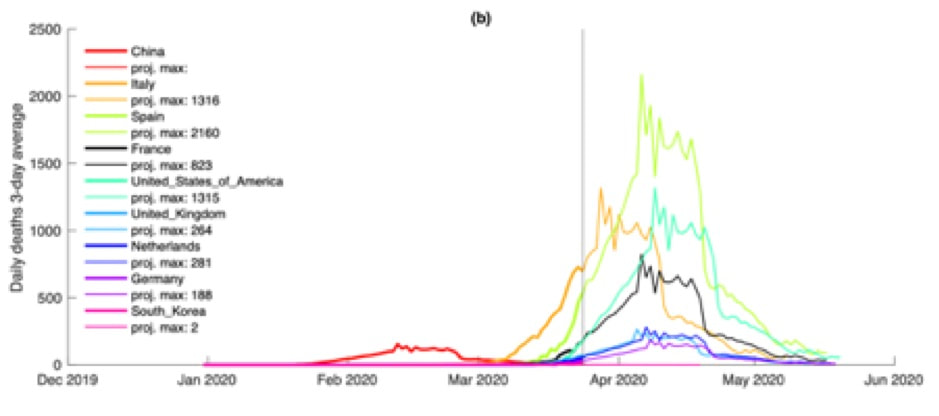
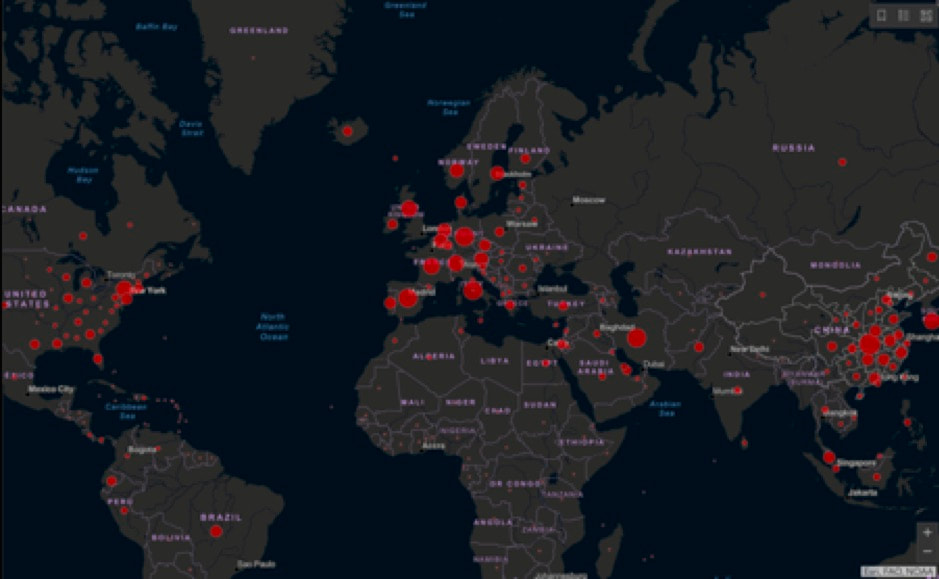
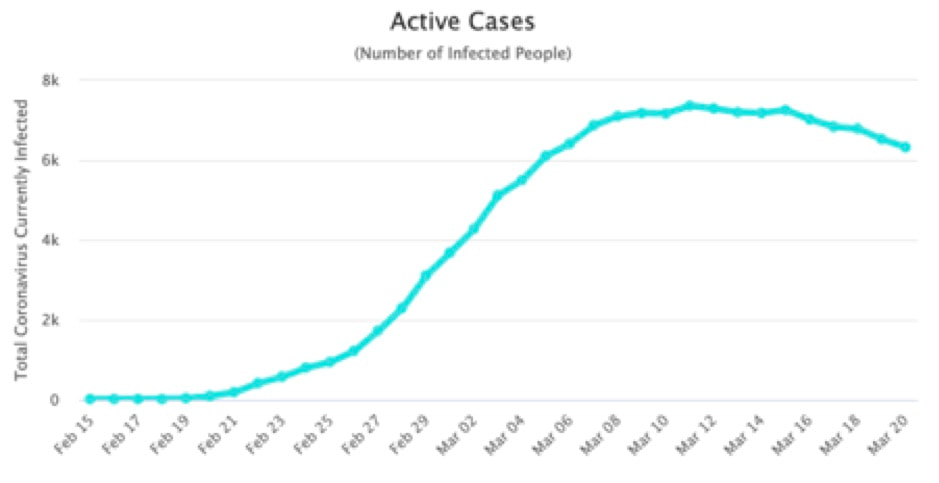
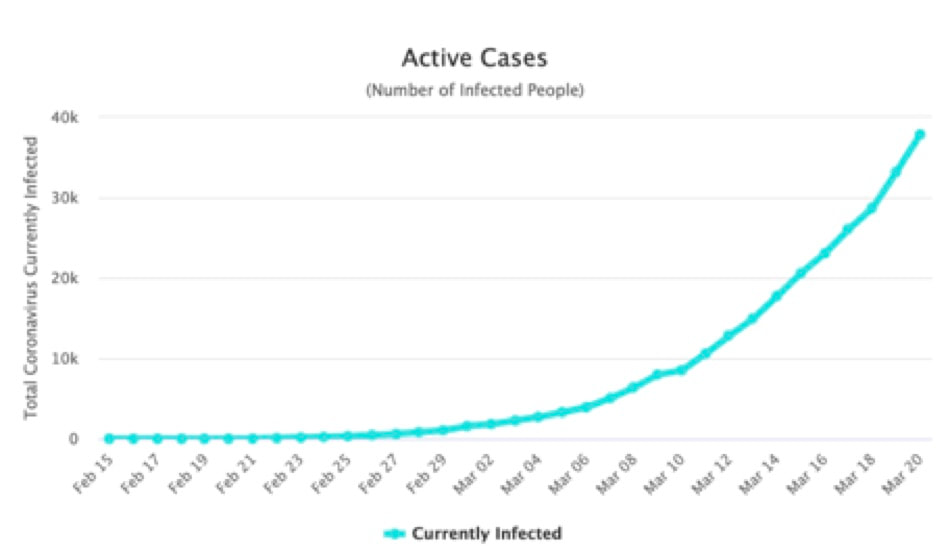
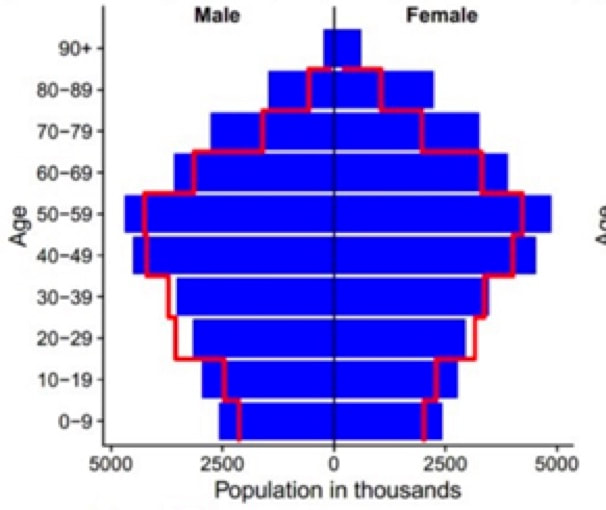
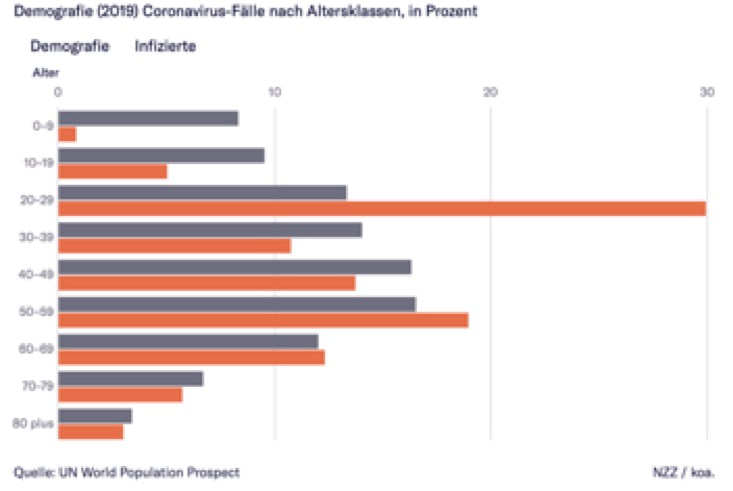
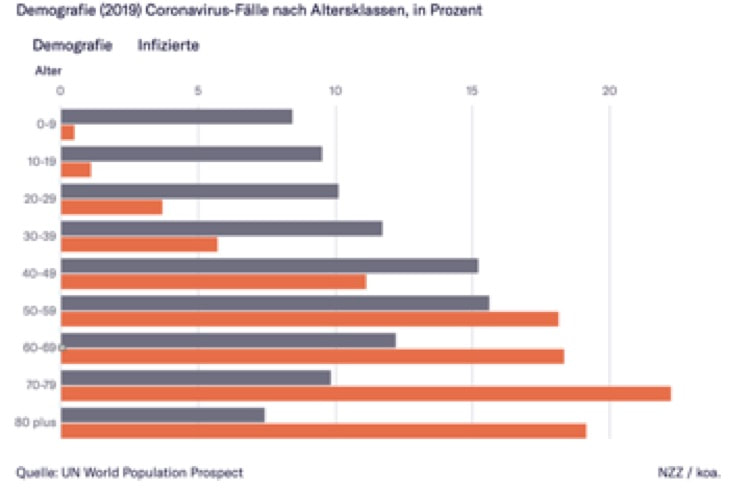
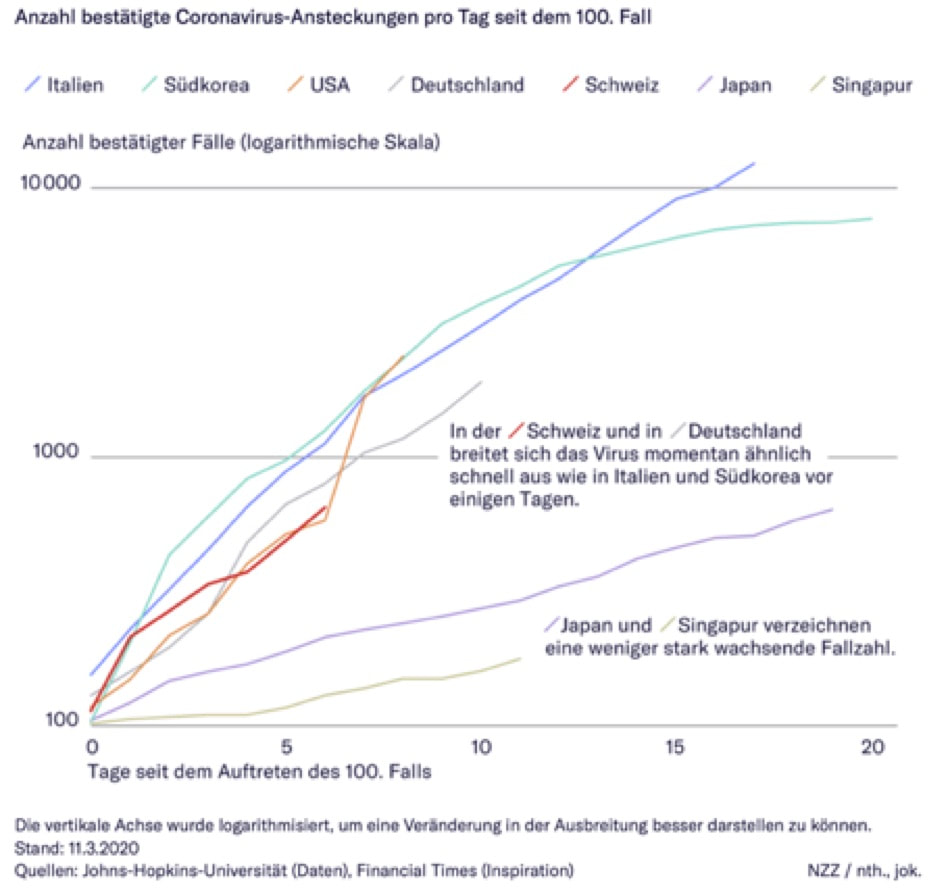
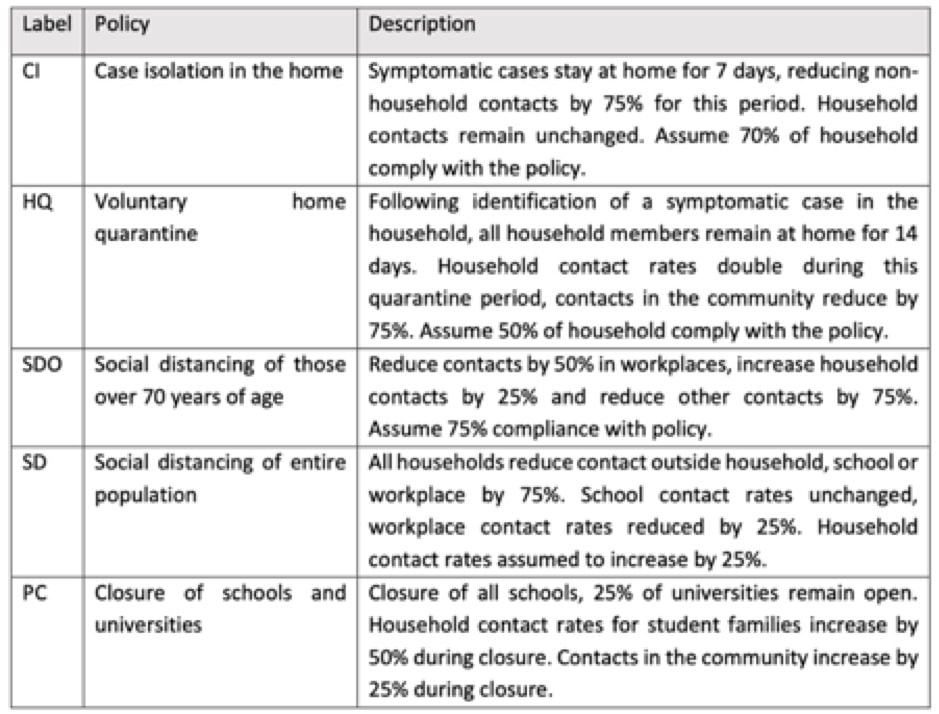
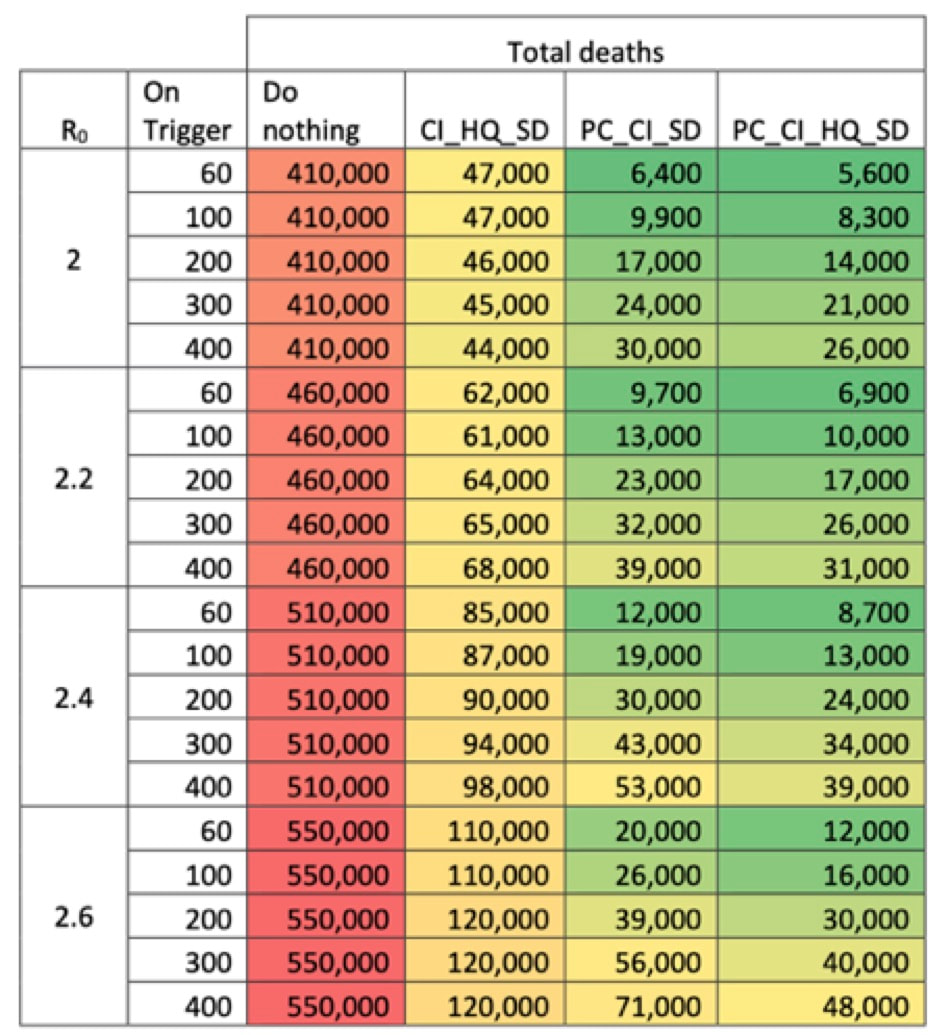
The numbers: WHO: Coronavirus disease 2019 (COVID-19) Situation Report–69, March 29 2020. https://www.who.int/docs/default-source/coronaviruse/situation-reports/20200329-sitrep-69-covid-19.pdf?sfvrsn=8d6620fa_2 Worldometer has an overview on number of cases etc of the Covid-19 Coronavirus pandemic. Found at https://www.worldometers.info/coronavirus/ A comparison of countries in East and West found in the German newspaper “Die Welt” https://www.welt.de/wissenschaft/article206607997/Corona-Ausbreitung-Diese-Kurve-kann-Deutschland-Hoffnung-machen.htm Similar comparisons found in the Financial Times March 29 at https://www.ft.com/coronavirus-latest An international comparison of the second derivative of COVID-19 deaths after implementation of social distancing measures by W. T. Pike1 and V. Saini https://www.sciencemediacentre.org/expert-reaction-to-unpublished-preprint-paper-on-modelling-deaths-from-covid-19-after-implementing-social-distancing-measures-in-different-countries/Paragraph. Other references Interview with Dr. Bruce Aylward in Time Magazine, on the different approaches to combat the Corona outbreaks in East and West. https://time.com/5805368/will-coronavirus-go-away-world-health-organization/ Report 11: Evidence of initial success for China exiting COVID-19 social distancing policy after achieving containment. Kylie E C Ainslie et al. https://www.imperial.ac.uk/media/imperial-college/medicine/sph/ide/gida-fellowships/Imperial-College-COVID19-Exiting-Social-Distancing-24-03-2020.pdf Report 12: The Global Impact of COVID-19 and Strategies for Mitigation and Suppression. Patrick GT Walker et al. https://www.imperial.ac.uk/mrc-global-infectious-disease-analysis/news--wuhan-coronavirus/ On flattening the curve, or as Boris Johnson put it “Squash the Sombrero,” a Corona simulation article in the Washington Post https://www.washingtonpost.com/graphics/2020/world/corona-simulator/ A correspondence discussing “Aerosol and Surface Stability of SARS-CoV-2 as Compared with SARS-CoV-1” Neeltje van Doremalen et al. Shows that Covid-19 aerosols can be detected in the air for up to three hours and on surfaces for up to 72 hours. https://www.nejm.org/doi/full/10.1056/NEJMc2004973 Addendum (Mach 30): Chinese handbook Covid-19 on prevention and treatment available for free. ”Handbook of COVID-19 Prevention and Treatment,” sponsored by Jack Ma Foundation. The First Affiliated Hospital, Zhejiang University School of Medicine. Compiled According to Clinical Experience http://www.zju.edu.cn/english/2020/0323/c19573a1987520/page.htm To the cure of these maladies nor counsel of physician nor virtue of any medicine appeared to avail or profit aught; on the contrary,—whether it was that the nature of the infection suffered it not or that the ignorance of the physicians (of whom, over and above the men of art, the number, both men and women, who had never had any teaching of medicine, was become exceeding great,) availed not to know whence it arose and consequently took not due measures there against,—not only did few recover thereof, but well nigh all died within the third day from the appearance of the aforesaid signs, this sooner and that later, and for the most part without fever or other accident (First Day, The Decameron, Giovanni Boccaccio) The growing numbers Map showing global cases of Coronavirus COVID-19 by the Center for Systems Science and Engineering (CSSE) at Johns Hopkins University (JHU), 3/21/2020. Updates may be found here: China versus Italy – an ominous comparison Take a look at these numbers comparing China and the grim example of Italy (stand March 21, Johns Hopkins Coronavirus Resource Center): China with a population of around 1,4 billion Confirmed cases 81,286 Deaths 3,259 Total recovered 71,854 Italy with a population of around 60 million Confirmed cases 47,021 Deaths 4,032 Total recovered 4,440 What is going on in Italy? China with a total population around 23 times larger than Italy’s has less Corona deaths than Italy. In China the number of new cases registered daily are steadily declining, presumably meaning that the China has long passed the peak. According to the South China Morning Post China on March 19 had zero new domestic cases, but 34 new cases from overseas and recorded a total 8 deaths. Using the numbers for confirmed cases and deaths, China would show a mortality rate around 4.0 percent. In Italy the number of new cases registered by March 20 reached 5.986, while the number of deaths reached 627. The Corona or Covid-19 pandemic in Italy certainly hasn’t peaked, but the number of deaths in Italy has already eclipsed the numbers of deaths in China. Calculating the mortality rate in same simple way for Italy shows a mortality rate that is more than twice as high as in China at around 8.5 percent. To calculate the mortality rate in this way doesn’t actually show the real mortality rate. There is the problem of time lag in the number of deaths. “Patients who die on any given day were infected much earlier, and thus the denominator of the mortality rate should be the total number of patients infected at the same time as those who died.” (The Lancet). An estimate of the mortality rate taking into account the time lag finds mortality levels off at a rate of around 5.7 percent. Other calculations reach different results. Still these calculation only show the mortality rate in relation to the number of cases registered, but there will be an unknown number of unreported cases, people who may have been infected with the virus but haven’t had symptoms. To get an estimate of the real mortality rate one would have to carry out many more tests of the population, or perform some form of sampling. Even taking into account the difficulty of calculating the real mortality the eye-catching differences in the simple mortality rate between China and Italy certainly calls for some kind of explanation apart from the calculation problems. Why do we see such a rapid growth in cases and such high mortality rate in Italy? At the moment the number of deaths in Italy has already surpassed the number of deaths in China with a population that is so many times larger than Italy’s. How is that to be explained? Explanations for the Italian calamity? While the number comparisons of China and Italy highlights the enormity of the calamity that has befallen Italy, it might perhaps be more relevant to compare The Republic of Korea with a population of 51 million to Italy’s 60 million, in order to look for explanations for what is happening in Italy. A comparison of how the number of active Corona cases has developed from February 15 to March 20 highlights a significant difference between The Republic of Korea and Italy. Here the Graph for The Republic of Korea (Wordometers): The graph for Italy (Wordometers): While the curve in Korea peaks around March 8-10, the curve for Italy still show exponential growth and no peak as yet. Notable are also the absolute number represented on the Y axis. Looking at the mortality rate we also find a really big difference. While mortality rate in Italy at the moment stands at around 8.5 percent, The Republic of Korea hovers around 1 percent. March 20 Korea reported 3 deaths and 87 new cases. Total number of deaths was reported to be 100. An article in NZZ (Neue Zürcher Zeitung) contains an attempt to explain these very eye-catching differences between Italy and The Republic of Korea. In the article we find explanations related to demographic factors, social factors, the health systems and to the testing for Corona virus. Demographic explanation Using data from geographyrealm.com we first note that Italy and The Republic of Korea seem to have an almost similar age and sex distribution as seen in the graph below The graph shows age and sex distribution for Italy (blue colour) and for Korea (red colour). We note that Italy is slightly more top heavy, meaning that there more people in Italy in the oldest age groups. This in itself may contribute to a high mortality rate in Italy, as the Corona mortality is higher among older age groups. The NZZ article looks at the distribution of Corona deaths for the different age groups in Korea. It shows that the Corona cases have a similar distribution to the age distribution, with the glaring exception of the age group 20-29, where Corona cases are over represented. In Italy the picture is very different. Here the older age groups has a significant over representation of Corona cases as seen in the graph below: These differences between Italy and the Republic of South Korea may help explain the big differences in the overall mortality rate. A smaller proportion of cases among the older age groups will lead to a lower overall mortality, as mortality rates are generally low among the young population and high among the older population. Next problem. Why do the old age groups have such a high proportion of Corona infections in Italy. One explanation might be that the proportion of older people in Italy with one or more underlying diseases may be higher in Italy than in Korea, as underlying diseases raises the mortality. Another, very tentative explanation may relate to social behaviour. Social explanation A simple explanation may be that older people in Italy are far more social in their behaviour than older people in Korea, interacting much with family and other people. More social interaction of course leads to a higher risk of infection. This is also what the NZZ article asserts: “Gerade die älteren Menschen in Italien sind tendenziell viel draussen unterwegs, besuchen Familienmitglieder, Kinder und Grosskinder. Man kann davon ausgehen, dass die ältere Bevölkerung Italiens viele soziale Kontakte hatte, bevor vor einer Woche die Ausgangssperre verhängt wurde. In Südkorea ist es ganz anders: Ältere Menschen sind tendenziell viel zu Hause.” (NZZ). Another explanation for the big difference in the overall mortality rate may have something to do with the health system and the methods used to combat the spreading of infections. Health system and methods used to combat the Corona virus One of the more curious and controversial methods to combat the Corona virus in the Republic of Korea is reported to be a smartphone app, “allows those who have been ordered not to leave home, to stay in contact with case workers and report on their progress. It will also use GPS to keep track of their location to make sure they are not breaking their quarantine.” (technologyreview.com). When the number of cases escalated, not the least because of the irresponsible behaviour of the members of a sect, self-isolation and lockdown rules came into effect in Korea. “Once self-quarantine subjects receive an order from their local medical center, they are legally prohibited from leaving their quarantine areas—usually their homes—and are instructed to maintain strict separation from other people, including family members. Those in lockdown are assigned to a local government case officer, who checks in twice a day by phone to track the development of any symptoms, and mobile testing teams are deployed to collect samples if things escalate.” keep track of their location to make sure they are not breaking their quarantine.” (technologyreview.com) Korea has also been testing much more than other countries. At a very early stage it was decided to test aggressively by enhancing capacities to make possible 15.000 tests per day and using mobile drive through test sites. Around the middle of March “the Koreans have tested well over 290,000 people and identified over 8,000 infections.” The Italian approach certainly hasn’t been as effective as the Korean approach. According to Al Jazeera they also seem to have missed the first cases: “At the end of December, an uncommon number of pneumonia cases arrived at the hospital of Codogno in northern Italy, the head of the emergency ward, Stefano Paglia, told the newspaper La Repubblica. Some of these patients could carry the coronavirus, but doctors treated them as typical winter diseases.” (Al Jazeera). With the fast spreading of infections, it was soon evident that the system to test and treat Corona cases was overwhelmed. On march 10 it was reported that Italy was carrying out. 1005 test per million people, while the number for Korea was 4070 per million. Now of course Italy is finally acting aggressively in order to prevent a continuing rise in new cases. First locking down regions in Northern Italy and later putting the whole country into a lockdown. “One week into the nationwide lockdown and the call to stay home, no one is allowed to venture out unless there are medical reasons, an emergency or for proven work-related matters which must be self-certified and shown upon request to enforcers. Italians cannot even go for a walk or jog in the park because too many were meeting up in groups or kicking a soccer ball around. Italians can to the stores that are still open to buy food and other basic needs as long as they enter one at the time and keep a safe distance from each other.”(rfi.fr) A small experiment carried out in the small town of Vo’ Euganeo in Northern Italy may indicate the effectiveness of an approach combining widespread testing followed by isolation of all who test positive. Professor Andrea Cristani and his team carried out 3.300 tests on the whole population of the small town. 3 percent of the population tested positive, but importantly the majority of those “did not have any symptoms” according to Cristani, meaning that they would not have been found when only testing people suspected of having been infected. All cases testing positive were put in isolation, and after two weeks the whole population was tested again. "The lesson we learned is that isolating all positive cases, whether they were sick or not, we were able to reduce transmission by 90 percent” (Cristani). At the first test 3 percent were found to be infected two weeks later only 0.25 were found to be infected. The lesson being that widespread testing followed by isolation is effective in preventing the spread of the virus. A lesson that would seem to fit with experience in the Republic of Korea. West versus East – the weakness of democracies? A comparison of the growth in the number of Corona cases in different countries after they have experienced their first 100 cases show a marked difference between countries in the West compared with countries in the East (NZZ). The comparison is more than a week old, but it shows that the growth path for Corona infections especially in Japan and Singapore are much lower than in countries like Italy, USA, Germany and Switzerland. The Republic of Korea look similar to the Western countries in the beginning but the curve points to an early peak, which is confirmed by later data, as we have already seen. Does this again have something to do with a less aggressive approach to testing and isolation in the West compared to the East? The differences seem to point to something even more fundamental, as it also seems to relate to the difference between cultures dominated by individualistic, libertarian and basic democratic values versus Eastern countries a more collectivistic, less libertarian culture and perhaps younger and more formal democracies. History may indicate that democracies are always slower to react fast and aggressively to major threats to their societies, taking much longer to get their act together and be united in their efforts. This may also have been the case in the UK From a crazy idea of herd immunisation to hesitant day by day interventions On March 3 the UK published a Corona virus action plan containing the idea of four sequential steps in dealing with the Corona virus in the UK (gov.uk): The overall phases of our plan to respond to COVID-19 are: • Contain: detect early cases, follow up close contacts, and prevent the disease taking hold in this country for as long as is reasonably possible • Delay: slow the spread in this country, if it does take hold, lowering the peak impact and pushing it away from the winter season • Research: better understand the virus and the actions that will lessen its effect on the UK population; innovate responses including diagnostics, drugs and vaccines; use the evidence to inform the development of the most effective models of care • Mitigate: provide the best care possible for people who become ill, support hospitals to maintain essential services and ensure ongoing support for people ill in the community to minimise the overall impact of the disease on society, public services and on the economy. Apparently using pandemic influenza trajectories for inspiration the action plan “focused on the continuity of public and critical services and the stability of the economy.” Perhaps the idea of using pandemic influenza for inspiration lead the Chief Scientific Advisor, Sir Patrick Vallance, to propose that in order to combat the Corona virus the population of the whole the UK would need to achieve herd immunity. The argument being that in taking a rash approach to contain the spread of the virus, isolating infected people and locking down society in various ways, one might just postpone the inevitable spread of the virus. As soon the lockdown was relaxed the virus would pop up and spread again. Instead Patrick Vallance argued that one ought to delay the peak in order for hospitals being able to cope with the most severe cases, while allowing milder cases to spread freely. In essence attempting to achieve herd immunity for a major part of the population. “If the virus keeps spreading, eventually so many people will have been infected and (if they survive) become immune that the outbreak will fizzle out on its own as the germ finds it harder and harder to find a susceptible host. This phenomenon is known as herd immunity” This seems to be what the Chief Scientific Advisor had in mind when talking about the UK approach being based upon strict scientific advice (as if this would be in contrast to the approach elsewhere) in press conference at Downing Street with the prime Minister. In an interview at Sky News he repeated the idea of a herd approach “Allowing enough of us to then get mild illness to become immune to this to help with a sort of whole population response which would protect everybody.” Apparently seeing a parallel to the kind of her immunity that one might find with a known pandemic influenza. Asked what proportion of the population might need to be infected to achieve this herd immunity his guess: ”Probably about 60 percent” ( Sky News). But the Corona pandemic isn’t an influenza pandemic, mortality rates are way higher, and a lot about the consequences of the spread of the Corona virus is unknown. Which would mean that the herd approach might be really lethal for many more people than an influenza pandemic. Assuming even a low mortality rate of 1 percent this would mean a catastrophic result in the UK with its 68 million people. If 60 percent were to be infected it would mean that around 40 million would be infected and with a mortality rate of 1 percent this would result in around 400,000 deaths. And remember we don’t even know if people become resistant to the virus, and if they do for how long, meaning that Patrick Vallance’s idea of avoiding a later peak may not even be avoided. The herd approach would thus seem to be madness. Experts seem to concur. An epidemiologist from Harvard’s T.H. Chan School of Public Health describes how he thought that reports of the UK’s approach were meant to be satire, an example of English humour. Realising it was for real he compared the approach to a case where your house is on fire “and the people whom you have trusted with your care are not trying to put it out. Even though they knew it was coming, and could see what happened to the neighbours as they were overwhelmed with terrifying speed, the UK government has inexplicably chosen to encourage the flames, in the misguided notion that somehow they will be able to control them.” (Hanage in The Guardian). Catastrophic herd approach The potentially catastrophic consequences of herd approach were demonstrated in a study from the UK’s Imperial College COVID-19 Response Team. In the study the team tried to calculate what might happen under different scenarios. All calculations being based upon an “R naught” value of 2,4, which means that one contagious person might on average infect 2,4 persons. In order to stop a pandemic the R naught value would have to be 1 or less. A value of 1 would mean that ”the disease will stay alive and stable, but there won’t be an outbreak or an epidemic,” while a value less than 1 would mean that “the disease will decline and eventually die out.” The team also assumed a mortality rate of around 0,9 percent. In the first scenario the team looks at the rather unlikely scenario that nothing is done to prevent the spread of the virus. In this scenario they predict that 81% of the GB and US populations would be infected over the course of the epidemic. With the given assumptions this leads to prediction of 510.000 deaths in the UK. About the same order of magnitude that we got to with our simple calculation. The team also predicts that at its peak the demand for critical care beds (ICU or Intensive Care Units) would be over 30 times larger than the maximum available. Thus underlining the potential catastrophic consequences of the herd approach suggested by the UK’s the Chief Scientific Advisor. Next the team looked at various various intervention scenarios described in the table below (Covid-19 Response Team). The team then calculated how the interventions might affect the number of deaths, and peak demand for intensive care beds at hospitals, taking also into different values of R naught. The table below shows predicted number of deaths under the different intervention scenarios and various values of R naught (Covid-19 Response Team). Under the most favourable alternative with interview like (Public Closure of Schools), CI (Case isolation in the home), HQ (voluntary home quarantine), and SD (Social Distancing of the entire population), the enormous number of projected deaths from the do nothing scenario, which relied on herd immunity, would reduced from 510.000 (R naught =2.4) to somewhere between 8,700 to 39,000 deaths.
Peak demand for intensive care beds would be reduced from around 180.000 to a maximum of 4,900. Corona U-turn in the UK No wonder that soon after the study became known the stupidity of the herd approach was recognised and various intervention measures were brought into play, though still reluctantly and bit by bit and certainly not in the same aggressive way that was practised in other countries like for instance Denmark and France. The Prime Minister no longer suggests that the prime intervention is “washing your hands” which in an ironical sense seems to characterise what he had been doing in relation to the Corona virus up until then. Now social and physical distancing is recommended and elderly people are to self-isolate. Almost every day new interventions are hesitantly introduced in a somewhat haphazard manner. First school closures were ruled out, then a few days later schools are closed from Friday March 20. Demands for say lockdown of public transport in London, where there is comparably high incidence of cases, are ruled out at the moment, but that may change tomorrow. The Prime Minister still rejects the aggressive interventions found in other countries, like complete lockdowns, restricting all unnecessary activity outside home. He argues that the great liberal culture found in the UK means that people can act responsibly on their own. Once more one is reminded that liberal and democracies are always slower to react fast and aggressively to major threats to their societies, taking longer to get their act together and be united in their efforts. |
Author
Verner C. Petersen Archives
May 2024
|
